

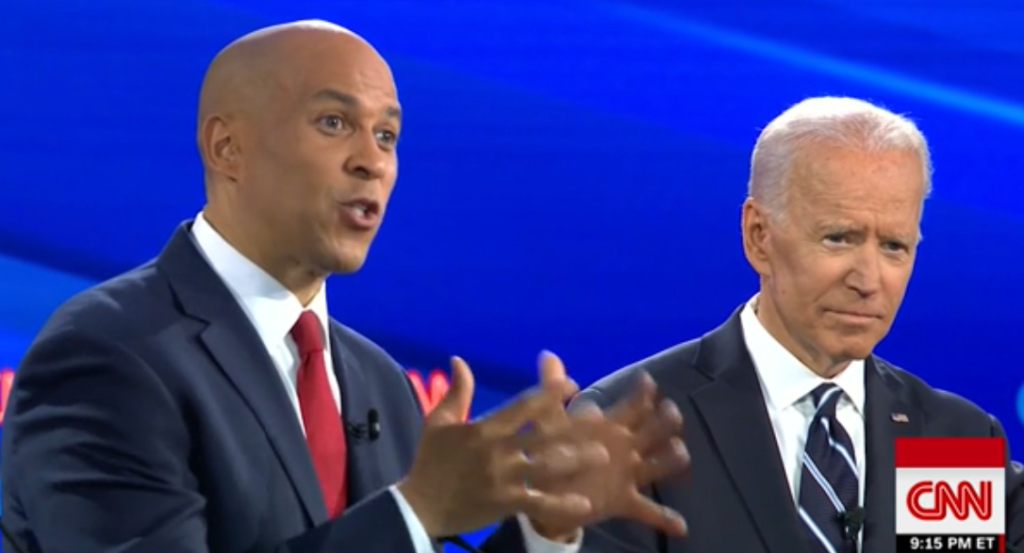
Monmouth Poll: Booker at 2% in South Carolina
Former Vice President Joe Biden remains the clear front-runner among likely Democratic voters in South Carolina. The Monmouth University Poll finds little has changed in overall presidential primary support, but there is evidence that black voters’ preference for the front-runner varies significantly when age and education are taken into account.
Biden currently holds 33% support among South Carolina voters who are likely to vote in the February 2020 Democratic primary. This is down slightly from his 39% support level in Monmouth’s July poll. Massachusetts Sen. Elizabeth Warren (16%) and Vermont Sen. Bernie Sanders (12%) are in the second tier of candidate preferences. Warren has improved on her 9% standing in July while Sanders was at a similar 10% then. California Sen. Kamala Harris has 6% support, which is down from 12% in July.
Other candidates registering at least 2% support in the poll are former hedge fund manager Tom Steyer (4%), South Bend Mayor Pete Buttigieg (3%), New Jersey Sen. Cory Booker (2%), Minnesota Sen. Amy Klobuchar (2%), and entrepreneur Andrew Yang (2%). The remaining nine candidates included in the poll receive 1% support or less. Another 15% of likely voters say they are not yet leaning toward any candidate in this race.
Shifts, or lack thereof, in the fortunes of these candidates can be seen more plainly when both the first and second choices of voters are examined. Biden is a top-two preference for 46% of Palmetto State Democrats (down slightly by 4 points from 50% in July), Warren is at 35% (up 16 points from 19%), Sanders is at 23% (same as 23% in July), and Harris is at 13% (down 15 points from 28%). However, Biden’s position as either a first or second choice candidate has dropped by 10 points among black voters (52% from 62% in July). Warren’s position as a top-two choice has improved among black voters (26% from 11% in July). Harris has declined as a top-two choice among black voters (17% from 28% in July), while Sanders remains about the same (25% from 23% in July).
“Biden is still in a pretty good position in South Carolina, but there are some signs that he might not have a true firewall among black voters. If he does not do well in the earlier contests in February, there may be potential for current preferences to shift here,” said Patrick Murray, director of the independent Monmouth University Polling Institute.
|
SOUTH CAROLINA DEMOCRATIC VOTER PREFERENCES Combined first and second choice %ages |
||||||
|
|
TOTAL |
WHITE |
BLACK |
|||
|
|
Oct |
July |
Oct |
July |
Oct |
July |
|
Joe Biden |
46% |
50% |
41% |
37% |
52% |
62% |
|
Elizabeth Warren |
35% |
19% |
52% |
31% |
26% |
11% |
|
Bernie Sanders |
23% |
23% |
20% |
25% |
25% |
23% |
|
Kamala Harris |
13% |
28% |
8% |
28% |
17% |
28% |
|
|
|
|
|
|
|
|
Biden is the top pick among black Democratic primary voters in South Carolina at 39%, with Warren (11%), Sanders (11%), Harris (8%) and the rest of the field trailing him by a wide margin. However, a significant number of black voters (19%) remain completely undecided on their preference and there are some sizable differences by age and education.
Among white Democratic voters, who make up about two-fifths of the likely electorate, it is a tight contest between Biden (28%) and Warren (24%), with Sanders (13%) and Buttigieg (8%) following behind. Just 6% of white voters say they do not have any candidate in mind as their pick.
Looking at a hypothetical nomination contest without Joe Biden in the race (by assigning his voters to their second choice candidate), suggests a very uncertain contest, with Warren at 25%, Sanders at 18%, Harris at 9%, Steyer at 6%, and Buttigieg at 5%, with 20% undecided among all South Carolina Democratic voters. Among white voters in a potential scenario without Biden, 37% back Warren, 14% Sanders, and 11% Buttigieg, with 10% undecided. Among black voters, the preferences are 20% Sanders, 17% Warren, 13% Harris, and 7% Steyer, with 25% undecided.
The poll also finds that South Carolina Democratic primary voters are not inclined to believe claims that Biden pressured the Ukraine government to fire its prosecutor in order to block an investigation of business activities involving Biden’s son. More than 6-in-10 feel that these claims about Biden are likely to be untrue, although only 28% say that they are definitely not true while another 35% say they are probably not true. Another 12% say these claims are probably true and 1% say they are definitely true.
A plurality of 44% say that this controversy has had no impact on Biden’s ability to beat President Donald Trump next year, but one-third (34%) say that it has actually hurt Biden. Just 4% say it has helped him. Nearly half (48%) say Biden’s response to the charges has been done with the right amount of force, but 23% say his response has not been forceful enough and 6% say his response has actually been too forceful."
“The issues around Biden and his son brought up in the Ukraine investigation do not seem to be having a significant impact on South Carolina Democrats right now. But some voters do seem to be worried about where this all might lead and how Biden is handling the controversy,” said Murray.
A majority (52%) of likely Democratic primary voters say it is very important that Democrats nominate someone who supports impeaching Trump. Currently, all candidates in the field have called for Trump’s impeachment. About half (49%) also say that it is very important for the party to nominate someone who will build on the legacy of former President Barack Obama. Black voters are more likely than white voters to prioritize both Trump’s impeachment (57% black to 44% white) and Obama’s legacy (57% black to 42% white).
The Monmouth University Poll asked likely Democratic primary voters to rate the 12 candidates who appeared on the debate stage earlier this month. For the most part, these ratings remain unchanged from Monmouth’s July poll. Biden holds the most positive rating at 76% favorable to 12% unfavorable. Other candidates with strong positive ratings are Warren (66% to 10%) and Sanders (66% to 18%).
Booker also continues to get strong net ratings (51% favorable to 11% unfavorable), although this has not translated to electoral support in the “horse race” question. Harris, on the other hand, has seen her ratings drop (51% favorable to 19% unfavorable) since the summer. Buttigieg (36% to 12%) and former Texas Rep. Beto O’Rourke (30% to 21%) remain about where they were in July.
Klobuchar (26% favorable to 15% unfavorable) and former cabinet secretary Julián Castro (22% to 20%) have seen their ratings decline since July. Of the remaining three candidates – all of whom have seen an uptick in name recognition since the summer – the net ratings for Steyer (31% to 16%) and Yang (25% to 17%) have improved while those for Hawaii Rep. Tulsi Gabbard (18% to 22%) have worsened.
|
2020 DEMOCRATIC FIELD |
||||
|
|
October |
July |
||
|
|
Net rating |
Favorable/ unfavorable |
Net rating |
Favorable/ unfavorable |
|
Joe Biden |
+64 |
76/12 |
+70 |
79/9 |
|
Elizabeth Warren |
+56 |
66/10 |
+60 |
67/7 |
|
Bernie Sanders |
+48 |
66/18 |
+53 |
67/14 |
|
Cory Booker |
+40 |
51/11 |
+37 |
49/12 |
|
Kamala Harris |
+32 |
51/19 |
+58 |
64/6 |
|
Pete Buttigieg |
+24 |
36/12 |
+25 |
36/11 |
|
Tom Steyer |
+15 |
31/16 |
+4 |
21/17 |
|
Beto O’Rourke |
+9 |
30/21 |
+14 |
32/18 |
|
Amy Klobuchar |
+11 |
26/15 |
+22 |
32/10 |
|
Andrew Yang |
+8 |
25/17 |
–1 |
13/14 |
|
Julián Castro |
+2 |
22/20 |
+21 |
31/10 |
|
Tulsi Gabbard |
–4 |
18/22 |
+7 |
20/13 |
|
|
|
|
|
|
Overall, 70% of likely voters say the candidate they back right now is the one they agree with the most on the issues. Just 8% say they tend to agree with another candidate more than the one they are currently backing. By comparison, 61% feel they are backing the most electable Democrat, while 13% say that another candidate in the field would actually be stronger against Trump. In a poll of likely New Hampshire voters conducted last month – in which Warren and Biden shared the lead – 69% said they were backing the candidate they were most aligned with and 52% said they felt their candidate choice was the strongest on electability.
The Monmouth University Poll was conducted by telephone from October 16 to 21, 2019 with 402 South Carolina voters who are likely to vote in the Democratic presidential primary in February 2020, out of 667 registered voters that were contacted for the poll. The question results in this release have a margin of error of +/- 4.9 percentage points. The poll was conducted by the Monmouth University Polling Institute in West Long Branch, NJ.
QUESTIONS AND RESULTS
(* Some columns may not add to 100% due to rounding.)
1. If the Democratic primary election for president was today, would you vote for [NAMES WERE ROTATED]? [If UNDECIDED: If you had to vote for one of these candidates at this moment, who do you lean toward?]
|
TREND: |
Oct. |
July |
|
Joe Biden |
33% |
39% |
|
Elizabeth Warren |
16% |
9% |
|
Bernie Sanders |
12% |
10% |
|
Kamala Harris |
6% |
12% |
|
Tom Steyer |
4% |
2% |
|
Pete Buttigieg |
3% |
5% |
|
Cory Booker |
2% |
2% |
|
Amy Klobuchar |
2% |
1% |
|
Andrew Yang |
2% |
0% |
|
Julián Castro |
1% |
<1% |
|
John Delaney |
1% |
0% |
|
Tulsi Gabbard |
1% |
<1% |
|
Beto O’Rourke |
1% |
1% |
|
Michael Bennet |
<1% |
1% |
|
Tim Ryan |
<1% |
0% |
|
Joe Sestak |
<1% |
0% |
|
Marianne Williamson |
<1% |
0% |
|
Steve Bullock |
0% |
0% |
|
(VOL) Other |
<1% |
1% |
|
(VOL) No one |
<1% |
<1% |
|
(VOL) Undecided |
15% |
17% |
|
(n) |
(402) |
(405) |
2. And who would be your second choice?
|
TREND: |
Oct. |
July |
|
Elizabeth Warren |
19% |
10% |
|
Joe Biden |
13% |
11% |
|
Bernie Sanders |
11% |
13% |
|
Kamala Harris |
7% |
16% |
|
Pete Buttigieg |
5% |
4% |
|
Cory Booker |
4% |
5% |
|
Tom Steyer |
2% |
1% |
|
Julián Castro |
1% |
0% |
|
John Delaney |
1% |
<1% |
|
Tulsi Gabbard |
1% |
<1% |
|
Amy Klobuchar |
1% |
1% |
|
Beto O’Rourke |
1% |
1% |
|
Marianne Williamson |
1% |
0% |
|
Andrew Yang |
1% |
<1% |
|
Steve Bullock |
<1% |
<1% |
|
Michael Bennet |
0% |
0% |
|
Tim Ryan |
0% |
0% |
|
Joe Sestak |
0% |
0% |
|
(VOL) Other |
<1% |
<1% |
|
(VOL) No one |
5% |
5% |
|
(VOL) Undecided |
25% |
30% |
|
(n) |
(402) |
(405) |
[QUESTIONS 3 & 4 WERE ROTATED]
3. When you think about the policy issues that are important to you, is the candidate you support now the one you tend to agree with the most on these issues, or is there another candidate running who you actually agree with more on these issues?
|
|
Oct. |
|
My candidate is who I agree with the most |
70% |
|
Another candidate who I agree with more |
8% |
|
(VOL) Other candidate agree with equally |
2% |
|
(VOL) Don’t know |
5% |
|
No candidate choice in Q1 |
15% |
|
(n) |
(402) |
4. When you think only about electability rather than the issues, is the candidate you support now the one you think has the best chance of beating Donald Trump in 2020, or is there another candidate running who you think would actually have a better chance of beating Trump?
|
|
Oct. |
|
My candidate has best chance |
61% |
|
Another candidate has best chance |
13% |
|
(VOL) Other candidate has equal chance |
2% |
|
(VOL) Don’t know |
9% |
|
No candidate choice in Q1 |
15% |
|
(n) |
(402) |
5. I’m going to read you the names of some people who are running for president in 2020. Please tell me if your general impression of each is favorable or unfavorable, or if you don’t really have an opinion. If you have not heard of the person, just let me know. [NAMES WERE ROTATED]
|
|
Favorable |
Unfavor-able |
No opinion |
Not heard of |
(n) |
|
Former Vice President Joe Biden |
76% |
12% |
11% |
0% |
(402) |
|
-- July 2019 |
79% |
9% |
10% |
1% |
(405) |
|
|
|
|
|
|
|
|
Vermont Senator Bernie Sanders |
66% |
18% |
13% |
2% |
(402) |
|
-- July 2019 |
67% |
14% |
16% |
2% |
(405) |
|
|
|
|
|
|
|
|
Massachusetts Senator Elizabeth Warren |
66% |
10% |
17% |
7% |
(402) |
|
-- July 2019 |
67% |
7% |
16% |
10% |
(405) |
|
|
|
|
|
|
|
|
Former Texas Congressman Beto O’Rourke |
30% |
21% |
29% |
20% |
(402) |
|
-- July 2019 |
32% |
18% |
28% |
23% |
(405) |
|
|
|
|
|
|
|
|
California Senator Kamala Harris |
51% |
19% |
20% |
10% |
(402) |
|
-- July 2019 |
64% |
6% |
18% |
13% |
(405) |
|
|
|
|
|
|
|
|
Minnesota Senator Amy Klobuchar |
26% |
15% |
34% |
25% |
(402) |
|
-- July 2019 |
32% |
10% |
28% |
30% |
(405) |
|
|
|
|
|
|
|
|
South Bend, Indiana Mayor Pete Buttigieg |
36% |
12% |
30% |
21% |
(402) |
|
-- July 2019 |
36% |
11% |
28% |
25% |
(405) |
|
|
|
|
|
|
|
|
New Jersey Senator Cory Booker |
51% |
11% |
26% |
12% |
(402) |
|
-- July 2019 |
49% |
12% |
25% |
14% |
(405) |
|
|
|
|
|
|
|
|
Former cabinet secretary Julián Castro |
22% |
20% |
37% |
21% |
(402) |
|
-- July 2019 |
31% |
10% |
33% |
27% |
(405) |
|
|
|
|
|
|
|
|
Hawaii Congresswoman Tulsi Gabbard |
18% |
22% |
34% |
26% |
(402) |
|
-- July 2019 |
20% |
13% |
33% |
34% |
(405) |
|
|
|
|
|
|
|
|
Entrepreneur Andrew Yang |
25% |
17% |
33% |
24% |
(402) |
|
-- July 2019 |
13% |
14% |
34% |
40% |
(405) |
|
|
|
|
|
|
|
|
Former hedge fund manager Tom Steyer |
31% |
16% |
32% |
21% |
(402) |
|
-- July 2019 |
21% |
17% |
28% |
34% |
(405) |
|
|
|
|
|
|
|
[QUESTIONS 6 & 7 WERE ROTATED]
6. How important is it to you that the Democrats nominate someone who supports impeaching Donald Trump – very important, somewhat important, not important, or are you not sure?
|
|
Oct. 2019 |
|
Very important |
52% |
|
Somewhat important |
17% |
|
Not important |
20% |
|
Not sure |
11% |
|
(n) |
(402) |
7. How important is it to you that the Democrats nominate someone who will build on the legacy of Barack Obama – very important, somewhat important, not important, or are you not sure?
|
|
Oct. 2019 |
|
Very important |
49% |
|
Somewhat important |
29% |
|
Not important |
14% |
|
Not sure |
8% |
|
(n) |
(402) |
8. How much have you heard about reports involving Joe Biden, his son, and activities in Ukraine – a lot, a little, or nothing at all?
|
|
Oct. 2019 |
|
A lot |
57% |
|
A little |
31% |
|
Nothing at all |
11% |
|
(n) |
(402) |
9. There are claims that Joe Biden pressured the Ukraine government to fire its prosecutor in order to keep that prosecutor from investigating the business activities of Biden’s son. Do you think these claims are definitely true, probably true, probably not true, or definitely not true?
|
|
Oct. 2019 |
|
Definitely true |
1% |
|
Probably true |
12% |
|
Probably not true |
35% |
|
Definitely not true |
28% |
|
(VOL) Don’t know |
12% |
|
Not heard (from Q8) |
11% |
|
(n) |
(402) |
10. Do you think these reports about Joe Biden’s involvement in Ukraine have helped or hurt his ability to defeat Donald Trump next year, or have they had no impact?
|
|
Oct. 2019 |
|
Helped |
4% |
|
Hurt |
34% |
|
No impact |
44% |
|
(VOL) Don’t know |
6% |
|
Not heard (from Q8) |
11% |
|
(n) |
(402) |
11. Do think Joe Biden’s response to the Ukraine story has been too forceful, has not been forceful enough, or has been done with the right amount of force?
|
|
Oct. 2019 |
|
Too forceful |
6% |
|
Not forceful enough |
23% |
|
Right amount of force |
48% |
|
(VOL) Don’t know |
13% |
|
Not heard (from Q8) |
11% |
|
(n) |
(402) |
METHODOLOGY
The Monmouth University Poll was sponsored and conducted by the Monmouth University Polling Institute from October 16 to 21, 2019 with a statewide random sample of 667 South Carolina voters drawn from a list of registered voters who participated in a primary or general election in the past two election cycles (excluding those who have consistently voted in Republican primaries). This includes 233 contacted by a live interviewer on a landline telephone and 434 contacted by a live interviewer on a cell phone, in English. Results are based on 402 voters who are likely to vote in the Democratic presidential primary in February 2020. Monmouth is responsible for all aspects of the survey design, data weighting and analysis. The full sample is weighted for age, gender, race, education and party primary vote history based on state voter registration list information and U.S. Census information (CPS 2018 supplement). Data collection support provided by Braun Research (field) and Aristotle (voter sample). For results based on the sample of likely Democratic primary voters, one can say with 95% confidence that the error attributable to sampling has a maximum margin of plus or minus 4.9 percentage points (unadjusted for sample design). Sampling error can be larger for sub-groups (see table below). In addition to sampling error, one should bear in mind that question wording and practical difficulties in conducting surveys can introduce error or bias into the findings of opinion polls.
|
DEMOGRAPHICS (weighted) |
|
|
|
Self-Reported Party |
|
77% Democrat |
|
23% None/other |
|
|
|
37% Male |
|
63% Female |
|
|
|
18% 18-34 |
|
24% 35-49 |
|
27% 50-64 |
|
31% 65+ |
|
|
|
35% White, non-Hispanic |
|
60% Black |
|
6% Other |
|
|
|
58% No degree |
|
42% 4 year degree |
|
MARGIN OF ERROR |
|
||
|
|
|
unweighted sample |
moe |
|
LIKELY DEMOCRATIC VOTERS |
|
402 |
4.9% |
|
SELF REPORTED PARTY ID |
Democrat |
307 |
5.6% |
|
None/other |
92 |
10.2% |
|
|
POLITICAL IDEOLOGY |
Liberal |
148 |
8.1% |
|
Moderate/Conservative |
233 |
6.4% |
|
|
GENDER |
Male |
162 |
7.7% |
|
Female |
240 |
6.3% |
|
|
AGE |
18-49 |
136 |
8.4% |
|
50-64 |
130 |
8.6% |
|
|
65+ |
133 |
8.5% |
|
|
RACE |
White |
140 |
8.3% |
|
|
Black |
230 |
6.5% |
|
COLLEGE GRADUATE |
No degree |
206 |
6.8% |
|
4 year degree |
193 |
7.1% |
|
|
INCOME |
<$50K |
167 |
7.6% |
|
$50K+ |
200 |
6.9% |
|
###


