The first major public poll of Newark in years reveals that while Democratic politicians generally remain popular, some long-term elected officials are largely unknown to residents of the state’s largest city. The poll also has good news for New Jersey Governor Phil Murphy, who enjoys strong approval ratings in Newark, boosting his chances in the upcoming race for governor.
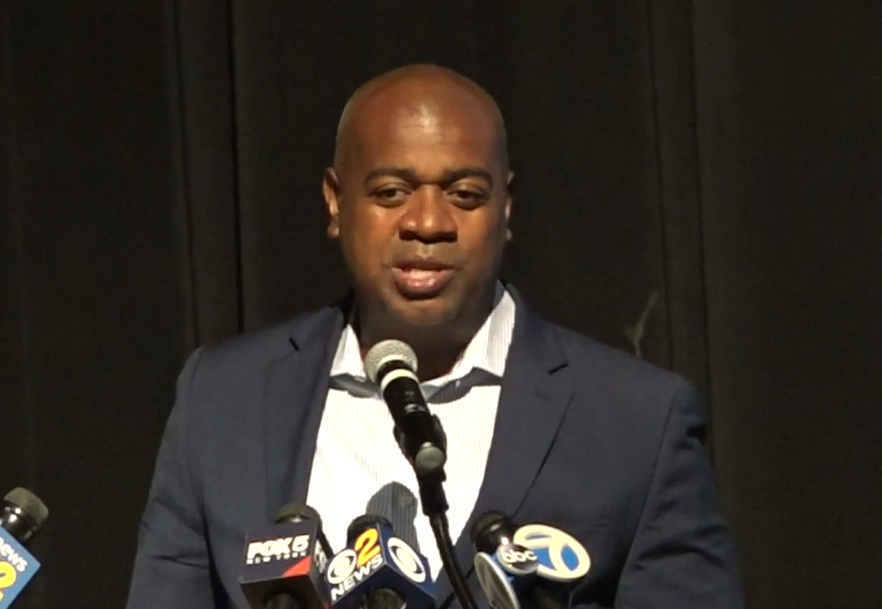
Heading into a reelection year in 2022, Newark Mayor Ras Baraka has a 60% approval rating, according to today's Fairleigh Dickinson University Poll. The poll finds that Murphy - up for reelection this year and intent on strong numbers in heavily Democratic Newark, New Jersey's most populous city - has a 64% approval rating.
In the House of Representatives, Newark (as well as other parts of Essex County, and areas in Union
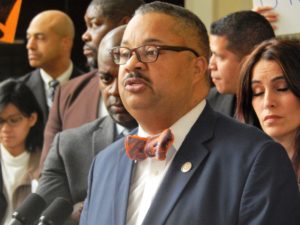
Congressman Payne
and Hudson counties) are represented by Don Payne, Jr., who has been in office since 2012, taking over the seat from his father. Prior to that, Payne served as president of the Newark City Council. Despite this long history with Newark, more than half of Newark residents say that they don’t know who he is, or don’t know enough about him to have an opinion (52 percent). Overall, only 37 percent of Newark residents say that they approve of Payne, though this outnumbers the small number (11 percent) who say that they disapprove of him.
Payne’s low name recognition extends to the groups that should be his main sources of support: among Democrats (who make up the majority of Newark residents), those who approve (47 percent) are about equal with those having no opinion (45 percent). Among African-American or Black voters, 48 percent approve of Payne, while 43 percent don’t know enough to have an opinion. These numbers are lower among Hispanic or Latino/a residents, two-thirds of whom (66 percent) say that they have no opinion of Payne, with only 23 percent approving.
“Payne is a formidable candidate who’s fought off a number of challengers in the past,” said Dan Cassino, a professor of Government and Politics at Fairleigh Dickinson University and the Executive Director of the poll. “But he only has to look next door to the eleventh district to see how quickly that can change.”
In 2018, incumbent Republican Rodney Frelinghuysen, who had gone without a serious electoral challenge for more than a decade and risen to chair one of the most powerful committees in the House of Representatives, resigned rather than face a hotly contested election. That seat is now held by a Democrat, Mikie Sherrill. While Payne is not up for re-election until next year, he already has a challenger for the Democratic primary, activist Imani Oakley, who has challenged Payne on his high number of missed votes and positioned herself in opposition to the state’s powerful political machines.
“Oakley pretty clearly sees this district as being similar to the one Alexandria Ocasio-Cortez was able to pick up in 2018,” said Cassino. “Incumbency normally helps candidates because it builds name recognition and favorability. If it hasn’t done that for Payne, he could be vulnerable.”
The last Democratic governor to go up for re-election, Jon Corzine, lost to Republican Chris Christie in 2009, partially because of relatively low turnout in urban areas of the northern New Jersey, like Newark. The results of the poll indicate that Murphy doesn’t have too much to worry about on that front. The incumbent governor has 64 percent approval in Newark, with just 16 percent saying that they disapprove of him, and only 20 percent saying that they don’t have an opinion, or declining to answer. Among the Democrats who make up the majority of the city, his approval is at 74 percent, and his approval is almost even (36 percent approving to 41 percent disapproving) among the ten percent of the city identifying as Republican. As with Payne, Murphy’s approval numbers are lowest among Hispanic and Latino/a residents, but even there, he has 52 percent approval.
“Murphy seems to be in good shape in Newark,” said Cassino. “But all the support in the world doesn’t matter if you can’t get people to the polls, and that’s always the challenge in an off-year election like the one coming up.”
The other statewide politician most closely associated with the Brick City, Senator Cory Booker, enjoys approval ratings similar to Murphy. Sixty-one percent of residents say that they approve of Booker, with only 17 disapproving – almost identical to the numbers posted by Murphy.
President Joe Biden posts the highest approval ratings of any of the candidates Newark residents were asked about, with 69 percent of respondents approving of him, including 84 percent of Democrats in the city, and 35 percent of the smaller group of Republicans. Biden’s approval is higher among African-American or Black residents, at 76 percent, compared with 62 percent approval among white and Hispanic or Latino/a residents.
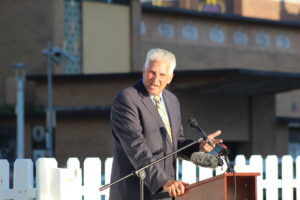
Essex County Executive Joe DiVincenzo
Long-time Essex County Executive Joe DiVincenzo, who has served in that post since 2003, and has been in elected office in Essex County for more than 30 years, does not enjoy the name recognition of statewide politicians like Booker or Murphy. A majority – 54 percent – of Newark residents don’t know enough to offer an opinion about him, though most of those with an opinion say that they approve of him (36 percent, versus 10 percent disapproval). As with many of the other politicians the poll asked about, his approval ratings – and his name recognition – are lowest among Hispanic and Latino/a residents.
Like Payne, DiVincenzo is on the ballot next year.
“Given the ubiquity of DiVincenzo’s name and face on county parks and facilities, it’s surprising that so few residents know who he is,” said Cassino. “But given the partisan make-up of Essex County, and the fact that he’s unlikely to attract a strong primary challenger, it probably doesn’t matter for his electoral future.”
Methodology
The survey was conducted between July 9 and August 11, 2021, using a certified list of residents of Newark, New Jersey. Voters were randomly chosen from the list, and contacted in one of two ways. Three-quarters of the respondents (827) received an invitation through SMS (text) to fill out the survey online, via a provided link. The other quarter of respondents (273) were contacted via telephone, using the same registered voter list. The survey covers 1,100 Newark residents, ages 18 and older, and was conducted mostly in English (1039), with the remainder in Spanish (57) and Portuguese (4). The survey was carried out by Braun Research, Inc, of Princeton, New Jersey. Of the interviews, 146 were conducted over landlines, the remainder via cell phones.
The survey included a significant oversample of African-American/Black voters in Newark, which allows for more accurate comparisons between this and other groups, as well as the calculation of subgroup characteristics that would not be possible in a simple probability sample. Such oversamples necessarily require additional weighting in order to calculate population-level values, but the weights used for this are not included in the calculation of design effects, as they do not indicate a divergence between the sample and the population.
The data were weighted to be representative of the registered voter population of New Jersey. The weights used, like all weights, balance the demographic characteristics of the sample to match known population parameters. The weighted results used here are balanced to match parameters for sex, age, and race/ethnicity.
SPSSINC RAKE, an SPSS extension module that simultaneously balances the distributions of all variables using the GENLOG procedure, was used to produce final weights. Weights were trimmed to prevent individual interviews from having too much influence on the final results. The use of these weights in statistical analysis helps to ensure that the demographic characteristics of the sample approximate the demographic characteristics of the target population. The size of these weights is used to construct the measure of design effects, which indicate the extent to which the reported results are being driven by the weights applied to the data, rather than found in the data itself. Simply put, these design effects tell us how many additional respondents would have been needed to get the weighted number of respondents across weighted categories: larger design effects indicate greater levels of under-representation in the data. In this case, calculated design effects are approximately 1.25.
All surveys are subject to sampling error, which is the expected probable difference between interviewing everyone in a population versus a scientific sampling drawn from that population. Sampling error should be adjusted to recognize the effect of weighting the data to better match the population. In this poll, the simple sampling error for 1100 residents of Newark is +/-2.96 percentage points, at a 95 percent confidence interval. Including the design effects, the margin of error would be +/-3.73 percentage points, though the figure not including them is much more commonly reported.
This error calculation does not take into account other sources of variation inherent in public opinion studies, such as non-response, question-wording, differences in translated forms, or context effects.
Weighted Telephone Sample Characteristics
1100 Newark Residents
Figures do not include respondents who declined to answer the demographic item in question
Man 47% N = 526
Woman 50% N = 548
Some Other Way 1% N = 13
18-24 14% N = 157
25-34 21% N = 234
35-44 18% N = 201
45-64 29% N = 311
65+ 13% N = 146
Democrat (with leaners) 59% N = 645
Independent 13% N = 142
Republican (with leaners) 10% N = 111
White 11% N = 124
Black 49% N = 528
Hispanic/Latino/a 36% N = 387
Asian 2% N = 23
Other/Multi-racial 2% N = 22
HS or Less 34% N = 376
Some College/Vocational 30% N = 329
College degree or more 34% N = 377
Question wording and order
Mayor Ras Baraka - Do you have a favorable opinion of them, an unfavorable opinion of them?
Governor Phil Murphy - Do you have a favorable opinion of them, an unfavorable opinion of them?
Senator Cory Booker - Do you have a favorable opinion of them, an unfavorable opinion of them?
County Executive Joe DiVincenzo - Do you have a favorable opinion of them, an unfavorable opinion of them?
President Joe Biden - Do you have a favorable opinion of them, an unfavorable opinion of them?
Representative Don Payne - Do you have a favorable opinion of them, an unfavorable opinion of them?