
Monmouth Poll: Menendez up 49-40% over Hugin
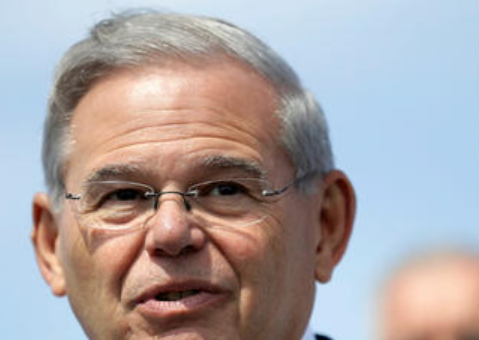
Bob Menendez holds a lead of between 9 and 12 points over Bob Hugin in the former’s bid for a third full term in the U.S. Senate, according to the latest Monmouth University Poll. While voters tend to hold a negative view of the Democratic incumbent, most feel that the behavior that led to his recent trial was probably no worse than what most other politicians do. Regardless of how they feel about Menendez, voters say that President Donald Trump is ultimately a bigger factor in their choice for Senate.
Menendez currently holds a 49% to 40% lead over Hugin among likely voters using Monmouth’s standard midterm turnout model. The poll also included Libertarian Murray Sabrin and the Green Party’s Madelyn Hoffman among the list of named candidates. Each receives 1% support while a generic “some other candidate” – there are an additional four names on the ballot – also receives 1%. The remaining 8% of likely voters are undecided.
The largest group of undecided voters is comprised of those from Latino, black, Asian and other non-white backgrounds (17%), with whom the incumbent has a formidable 63%-19% lead otherwise. Menendez also has a slight 48%-45% lead among white voters with a college degree. Hugin actually has the advantage among white voters without a college degree (49%-41%), but this group comprises fewer than 4-in-10 likely voters in New Jersey.
The incumbent’s lead expands to 50%-39% using a model that incorporates a turnout surge in Democratic areas of the state. A model projecting lower overall turnout also shows Menendez with a comfortable lead of 51% to 39%. All leads in the current likely voter models are statistically significant. As a point of comparison, the Democratic candidates in the last three statewide contests each won their respective races by 14 points (2017 governor, 2016 president, 2014 U.S. Senate).
“Given the national political climate and the big registration advantage enjoyed by Democrats, you might expect an incumbent senator from New Jersey to be up by 20 points. Hugin was successful in making this one competitive by hammering away at Menendez’s ethical baggage. But the incumbent has been able to fight back to get the margin into a range that is closer to the norm for New Jersey,” said Patrick Murray, director of the independent Monmouth University Polling Institute. Murray added, “I bet the Democrat’s Senate Majority PAC wishes it could take back the $3 million being spent in New Jersey right now.” This is Monmouth’s first, and only, likely voter poll of the Garden State’s Senate contest.
New Jersey’s senior senator does not earn great ratings from his constituents, but he is certainly in better standing than the president. And when it comes to casting a vote in the Senate contest, a majority (56%) say that their views of Trump are more important than their views of Menendez (31%). Trump gets a negative job rating of 42% approve and 55% disapprove from likely New Jersey voters. The poll finds that 72% of likely voters say that Trump is a very important factor in their Senate choice, with Trump opponents (84%) being more likely than Trump supporters (71%) to feel this way.
“If these poll results hold, the first person Bob Menendez should thank in his election night victory speech is Donald Trump,” said Murray.
Menendez has a negative personal rating of 28% favorable and 45% unfavorable, with 27% offering no opinion. Nearly 9-in-10 likely voters (88%) are aware of the senator’s recent trial, but 64% feel that whatever Menendez did was about the same as what other politicians get up to. Just 22% say Menendez’s behavior was worse than most other politicians.
“You’ve got to wonder if New Jersey voters look at corruption through a different lens than other voters. But it’s worth pointing out that Republican House incumbents in upstate New York and southern California are currently under indictment and remain competitive in their re-election efforts. So perhaps the goalposts have been moved nationwide in recent years,” said Murray.
The top issues in the New Jersey Senate race, among the six asked about in the poll, are health care (24%) and corruption in government (22%). Taxes (18%), immigration (14%), job creation (10%), and abortion (7%) round out the list. Not surprisingly, Hugin is trusted more than Menendez when it comes to bringing integrity to government (39% to 26%, with 18% saying they trust both candidates equally and 12% volunteering that they trust neither one). Menendez is trusted more than Hugin when it comes to keeping health care affordable (40% to 28%, with 15% saying they trust both candidates equally and 10% volunteering that they trust neither one).
The poll finds 69% of voters are aware that Bob Hugin is a former pharmaceutical company executive. Nearly half of likely voters (48%) view that industry negatively while only 14% hold a positive opinion of it and 31% take a neutral view. Hugin’s overall personal rating is a somewhat positive 31% favorable and 21% unfavorable, but nearly half (48%) have not formed an opinion of the Republican either way.
“Hugin’s pharma past does not help him in a year when worries about rising health care costs top the list of voter concerns, which is true not just in New Jersey but nationwide,” said Murray.
While the nomination of Brett Kavanaugh to the Supreme Court generated a lot of speculation on how it would impact the midterm elections, Monmouth finds it really isn’t decisive in New Jersey’s Senate contest. This finding echoes the results of Monmouth’s polling in other races conducted over the last few weeks. Fully 83% of likely voters say the Kavanaugh issue has not impacted their Senate choice, while 6% say it has made them more likely to support Menendez, 6% say it has made them more likely to support Hugin, and 3% say it has made them more undecided.
The Monmouth University Poll also asked voters statewide about their local House district races. Overall, 56% of these voters say they will vote for the Democratic candidate and 36% will vote for the Republican. If this result holds, it would mark a substantially better result for Congressional Democrats in New Jersey than in recent elections. Democrats won the statewide House vote by 8 points (53% to 45%) in 2016 and by an even smaller 2 points (50% to 48%) in the 2014 midterm.
Moreover, the poll finds that the overall swing is coming mainly from GOP-held seats.
In the five House seats currently held by a Republican, voter preference is split at 48% for the Democrat and 45% for the GOP candidate. The aggregate vote from these five districts in the past two House elections averaged a sizable 22 point advantage for the Republicans (59% - 38% in 2016 and 61% - 38% in 2014). On the other hand, the poll’s vote share in the seven seats currently held by Democrats – 61% Dem to 30% GOP – is in line with the average 30 point advantage Democrats held in these districts in both 2016 (65% - 32%) and 2014 (62% - 36%).
Despite the competitive nature of these House seats, New Jersey voters say they are more enthusiastic about voting in the U.S. Senate race (46%) than their local congressional district (17%), with another 32% saying they are equally enthusiastic about both contests. There is no difference in this opinion between voters who live in Democratic or Republican districts.
“A statewide race will always be the marquee contest. The question this year is whether ambivalence about the candidates at the top of the ticket or the Trump factor will have more of an impact down ballot. We won’t know the answer to that until November 6,” said Murray.
The Monmouth University Poll was conducted by telephone from October 11 to 15, 2018 with 527 New Jersey residents likely to vote in the November election. The question results in this release have a margin of error of +/-4.3 percentage points. The error of the difference between the two candidates’ vote share (i.e. the “lead”) is +/-6.0 percentage points. The poll was conducted by the Monmouth University Polling Institute in West Long Branch, NJ.
QUESTIONS AND RESULTS
(* Some columns may not add to 100% due to rounding.)
1/2. If the election for U.S. Senate was today, would you vote for Bob Hugin the Republican, Bob Menendez the Democrat, Murray Sabrin the Libertarian, Madelyn Hoffman of the Green Party, or some other candidate? [IF UNDECIDED: If you had to vote for one of the following at this moment, do you lean more toward Bob Hugin or more toward Bob Menendez?] [NAMES WERE ROTATED]
|
Likely Voters |
Oct. 2018 |
||
|
Standard |
Democratic |
Low Turnout |
|
|
Bob Hugin |
40% |
39% |
39% |
|
Bob Menendez |
49% |
50% |
51% |
|
Murray Sabrin |
1% |
1% |
1% |
|
Madelyn Hoffman |
1% |
1% |
1% |
|
Other |
1% |
1% |
1% |
|
(VOL) Undecided |
8% |
9% |
8% |
|
(n) |
(527) |
(527) |
(527) |
3. If the election for U.S. House of Representatives in your district was today, would you vote for the Republican or the Democratic candidate? [ITEMS WERE ROTATED]
|
Likely Voter Standard |
Oct. |
|
Republican |
36% |
|
Democratic |
56% |
|
(VOL) Other candidate |
1% |
|
(VOL) Don’t know |
7% |
|
(n) |
(527) |
[QUESTIONS 4 & 5 WERE ROTATED]
4. Is your general impression of Bob Hugin favorable or unfavorable, or do you have no opinion of him?
|
Likely Voter Standard |
Oct. |
|
Favorable |
31% |
|
Unfavorable |
21% |
|
No opinion |
48% |
|
(n) |
(527) |
5. Is your general impression of Bob Menendez favorable or unfavorable, or do you have no opinion of him?
|
Likely Voter Standard |
Oct. |
|
Favorable |
28% |
|
Unfavorable |
45% |
|
No opinion |
27% |
|
(n) |
(527) |
6. How much interest do you have in the upcoming election – a lot of interest, a little interest, or not much interest at all?
|
Likely Voter Standard |
Oct. |
|
A lot |
79% |
|
A little |
17% |
|
Not much at all |
4% |
|
(VOL) Don't Know |
0% |
|
(n) |
(527) |
7. Would you say you are more enthusiastic about voting in the U.S. Senate race or more enthusiastic about voting in your local House district race?
|
Likely Voter Standard |
Oct. |
|
Senate race |
46% |
|
Local House district race |
17% |
|
(VOL) Both equally |
32% |
|
(VOL) Neither |
3% |
|
(VOL) Don't Know |
3% |
|
(n) |
(527) |
8. Have you been following the election campaign very closely, somewhat closely, or not too closely?
|
Likely Voter Standard |
Oct. |
|
Very closely |
35% |
|
Somewhat closely |
47% |
|
Not too closely |
17% |
|
(VOL) Don't Know |
1% |
|
(n) |
(527) |
9. Do you approve or disapprove of the job Donald Trump is doing as president? [Do you (approve/disapprove) strongly or somewhat?]
|
Likely Voter Standard |
Oct. |
|
Strongly approve |
29% |
|
Somewhat approve |
13% |
|
Somewhat disapprove |
6% |
|
Strongly disapprove |
49% |
|
(VOL) Don't Know |
4% |
|
(n) |
(527) |
10. On most issues would you say you support or oppose what President Trump is doing?
|
Likely Voter Standard |
Oct. |
|
Support |
40% |
|
Oppose |
52% |
|
(VOL) Depends/both |
5% |
|
(VOL) Don't Know |
3% |
|
(n) |
(527) |
11. How important is it for you to cast a vote for Congress that shows your [support of/opposition to] President Trump – very important, somewhat important, not too important, or not at all important?
|
Likely Voter Standard |
Oct. |
|
Very important |
72% |
|
Somewhat important |
11% |
|
Not too important |
5% |
|
Not at all important |
4% |
|
(VOL) Don't Know |
8% |
|
(n) |
(527) |
12. Which is a more important factor in your vote for U.S. Senate - your views of Bob Menendez or your views of Donald Trump? [CHOICES WERE ROTATED]
|
Likely Voter Standard |
Oct. |
|
Views of Bob Menendez |
31% |
|
Views of Donald Trump |
56% |
|
(VOL) Both equally |
6% |
|
(VOL) Don't Know |
7% |
|
(n) |
(527) |
13. Please tell me which one of the following issues is most important to you in your vote choice for U.S. Senate? [ITEMS WERE ROTATED]
|
Likely Voter Standard |
Oct. |
|
Immigration |
14% |
|
Health care |
24% |
|
Corruption in government |
22% |
|
Abortion |
7% |
|
Taxes |
18% |
|
Job creation |
10% |
|
(VOL) Other |
3% |
|
(VOL) Don’t know |
3% |
|
(n) |
(527) |
[QUESTIONS 14 & 15 WERE ROTATED]
14. Who do you trust more to work to keep health care affordable - Bob Hugin or Bob Menendez, or do you trust both equally? [NAMES WERE ROTATED]
|
Likely Voter Standard |
Oct. |
|
Bob Hugin |
28% |
|
Bob Menendez |
40% |
|
Both equally |
15% |
|
(VOL) Neither one |
10% |
|
(VOL) Don't Know |
7% |
|
(n) |
(527) |
15. Who do you trust more to bring integrity to government - Bob Hugin or Bob Menendez, or do you trust both equally? [NAMES WERE ROTATED]
|
Likely Voter Standard |
Oct. |
|
Bob Hugin |
39% |
|
Bob Menendez |
26% |
|
Both equally |
18% |
|
(VOL) Neither one |
12% |
|
(VOL) Don't Know |
6% |
|
(n) |
(527) |
[QUESTIONS 16/16A & 17/17A WERE ROTATED]
16. Are you aware that Bob Menendez was recently on trial for bribery and misuse of public office which ended in a mistrial, or have you not heard about this before?
|
Likely Voter Standard |
Oct. |
|
Aware |
88% |
|
Not heard |
12% |
|
(n) |
(527) |
16A. Based on what you have heard, do you think whatever Menendez did was worse than what most other politicians do or about the same as what most other politicians do?
|
Likely Voter Standard |
Oct. |
|
Worse |
22% |
|
Same |
64% |
|
(VOL) Depends/less serious |
5% |
|
(VOL) Don't Know |
9% |
|
(n) |
(527) |
17. In general do you tend to have a positive, negative, or neutral opinion of the pharmaceutical industry?
|
Likely Voter Standard |
Oct. |
|
Positive |
14% |
|
Negative |
48% |
|
Neutral |
31% |
|
(VOL) Mixed |
4% |
|
(VOL) Don't Know |
3% |
|
(n) |
(527) |
17A. Are you aware that Bob Hugin is a former pharmaceutical company executive or have you not heard about this before?
|
Likely Voter Standard |
Oct. |
|
Aware |
69% |
|
Not heard |
31% |
|
(n) |
(527) |
18. Has anything that’s happened in the last few weeks related to the nomination of Brett Kavanaugh to the Supreme Court caused you to change your mind about who you will support in the election for U.S. Senate, or hasn’t it changed your mind? [If “YES”: Has this made you more likely to support Hugin, more likely to support Menendez, or has it made you more undecided?]
|
Likely Voter Standard |
Oct. |
|
Yes, more likely to support Hugin |
6% |
|
Yes, more likely to support Menendez |
6% |
|
Yes, more undecided |
3% |
|
No, has not changed my mind |
83% |
|
(VOL) Not aware of nomination news |
0% |
|
(VOL) Don't Know |
2% |
|
(n) |
(527) |
METHODOLOGY
The Monmouth University Poll was sponsored and conducted by the Monmouth University Polling Institute from October 11 to 15, 2018 with a statewide random sample of 527 likely New Jersey voters, drawn from a list of registered voters who voted in at least one of the last four general or primary elections, or have registered to vote since January 2016. This includes 317 contacted by a live interviewer on a landline telephone and 210 contacted by a live interviewer on a cell phone. Monmouth is responsible for all aspects of the survey design, data weighting and analysis. Final sample is weighted for region, party registration, age, gender, education and race based on state voter registration list and U.S. Census information. Data collection support provided by Braun Research (field) and L2 (voter sample). For results based on this sample, one can say with 95% confidence that the error attributable to sampling has a maximum margin of plus or minus 4.3 percentage points (unadjusted for sample design). Sampling error can be larger for sub-groups (see table below). In addition to sampling error, one should bear in mind that question wording and practical difficulties in conducting surveys can introduce error or bias into the findings of opinion polls.
NJ Regions (by county):
Northeast – Bergen, Essex, Hudson, Passaic
Northwest – Hunterdon, Morris, Somerset, Sussex, Warren
Route 1 – Mercer, Middlesex, Union
Jersey Shore – Atlantic, Cape May, Monmouth, Ocean
Delaware Valley – Burlington, Camden, Cumberland, Gloucester, Salem
|
DEMOGRAPHICS (weighted) |
|
Party Registration |
|
28% Republican |
|
48% Democrat |
|
24% Unaffiliated |
|
|
|
Self-Reported |
|
24% Republican |
|
37% Independent |
|
39% Democrat |
|
|
|
46% Male |
|
54% Female |
|
|
|
12% 18-34 |
|
20% 35-49 |
|
36% 50-64 |
|
33% 65+ |
|
|
|
73% White |
|
12% Black |
|
11% Hispanic |
|
3% Asian |
|
1% Other |
|
|
|
56% No college degree |
|
44% 4-year college degree |
|
|
|
31% Northeast |
|
16% Northwest |
|
17% Route 1 |
|
18% Jersey Shore |
|
17% Delaware Valley |
|
|
|
MARGIN OF ERROR |
|||
|
unweighted sample |
moe (+/-) |
||
|
LIKELY VOTERS |
|
527 |
4.3% |
|
SELF-REPORTED PARTY ID |
Republican |
121 |
8.9% |
|
Independent |
210 |
6.8% |
|
|
Democrat |
184 |
7.2% |
|
|
IDEOLOGY |
Conservative |
134 |
8.5% |
|
Moderate |
234 |
6.4% |
|
|
Liberal |
140 |
8.3% |
|
|
GENDER |
Male |
262 |
6.1% |
|
Female |
265 |
6.0% |
|
|
AGE |
18-49 |
194 |
7.0% |
|
50-64 |
167 |
7.6% |
|
|
65+ |
156 |
7.9% |
|
|
COLLEGE by RACE |
White, No degree |
148 |
8.1% |
|
White, 4 year degree |
224 |
6.6% |
|
|
Other race, Latino |
130 |
8.6% |
|
|
VOTE CHOICE |
Hugin |
196 |
7.0% |
|
Menendez |
223 |
6.6% |
|
|
Other/undecided |
108 |
9.4% |
|
|
REGION |
Northeast |
149 |
8.0% |
|
Northwest |
87 |
10.5% |
|
|
Route 1 |
98 |
9.9% |
|
|
Jersey Shore |
101 |
9.8% |
|
|
Delaware Valley |
92 |
10.2% |
|
|
NJ CD PARTY CONTROL |
Republican |
247 |
6.2% |
|
Democrat |
280 |
5.9% |
|


