
Monmouth Poll: Impeachment Support Up Slightly, by Trump Job Rating Steady
President Donald Trump’s approval rating has remained steady in the wake of an official impeachment inquiry launched last week, although support for impeachment has ticked up slightly. In a two year Monmouth University Poll trend on impeachment opinion the current findings are not out of line with some prior results. The public does find the nature of Trump’s conversation with the Ukraine president Volodymyr Zelenskiy to have been inappropriate. They also say it was wrong to hold the whistleblower complaint from Congress even when the subject of the complaint is the president. The poll finds as well that news about the phone call may also have raised doubts about former Vice President Joe Biden.
Trump’s overall job rating stands at 41% approve and 53% disapprove, which is similar to his 40% to 53% rating in August. Over the past 12 months, the president’s approval rating has ranged from 40% to 44% in Monmouth’s polling, while his disapproval rating has ranged from 49% to 54%.
“I’ve been saying this for a long time. Fundamental opinion about Donald Trump has been baked in from

the very start of his presidency. Almost nothing he’s done has come as a surprise to the American public, which is why we see such little change in his job rating. The question is whether those who want Trump out of office are willing to wait until 2020 and that’s where we see a small shift,” said Patrick Murray, director of the independent Monmouth University Polling Institute.
At this time, 44% of Americans feel that Trump should be impeached and compelled to leave the presidency, while 52% disagree with this course of action. These numbers mark a shift from Monmouth’s prior poll in August (35% supported impeachment and 59% did not), but it is not the first time these results have been found in the two years Monmouth has been asking this question. This includes similar findings in March 2019 (42% for impeachment and 54% against) and July 2017 (41% for impeachment and 53% against). Current support for removing Trump from office comes from 77% of Democrats (up from 69% in August but similar to 75% in March), 41% of independents (up from 30% in August but similar to 40% in March), and 9% of Republicans (up from 2% in August but similar to 8% in March).
“We believe Monmouth has the longest trend line of public opinion on impeachment. This helps give a broader perspective to the recent shifts. Yes, support for impeachment has increased over the last week, but it’s not significantly higher than where it has been at other points in Trump’s presidency. At least not yet,” said Murray.
Monmouth asks the same impeachment question used by the Gallup Poll leading up to the House inquiry into Richard Nixon, which helps give another unique point of comparison. There are some stark differences in public opinion trends from that time to now. Whereas support for impeaching Trump has inched up from 36% in November 2018 to 44% in the current poll, support for impeaching Nixon jumped significantly from its starting point of 19% in June 1973 to 46% in April 1974 as the House was about to launch its official impeachment inquiry. In the same vein, while the overall trend in Trump’s job approval number has been steady (43% in November 2018 to 41% now), there was a significant drop in Nixon’s job rating over the comparable time period (from 44% in June 1973 to 25% in April 1974).
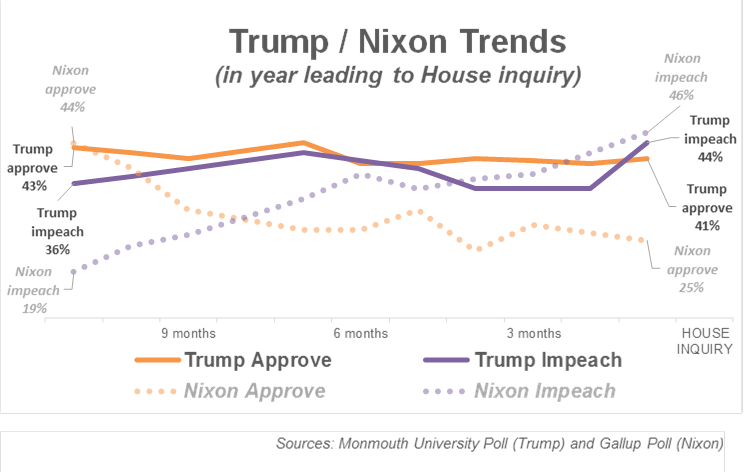
“It’s important to put these small shifts in context because we are living in much different times in terms of political norms. A year ago, Trump’s approval rating was a little higher than public support for his impeachment and now we see a slight gap in the opposite direction. This is in stark contrast to Nixon, who went from a more than 20 point gap in his favor on these two questions early in his second term to a 20 point gap in the opposite direction as the public reacted with shock to revelations about the president’s behavior,” said Murray.
There has been an increase in the number of Americans who say it is a good idea for the House Judiciary Committee to conduct an inquiry which may or may not lead to impeachment. This currently stands at 49%, which is up from 41% in August. Those who say such an inquiry is a bad idea is now 43%, down from 51% in August. Most Democrats feel it is a good idea for Congress to take this course of action (79%, up from 72% in August). They are joined by nearly half of independents (47%, up from 39% in August) and about 1-in-6 Republicans (16%, up from 8% in August). Among those who have heard a lot about reports that Trump asked Zelenskiy to investigate Biden, 56% say the inquiry is a good idea and 40% say it is a bad idea.
“Most of the public may not be on board with drawing up articles of impeachment just yet, but opposition to heading down that road has softened after recent events. Americans do appear to be somewhat disturbed by what they heard last week. Not that it changes their underlying opinion of the president, but it does slightly shift which actions they feel should be taken,” said Murray.
Just over half of the public (52%) has heard a lot about reports that Trump asked the Ukrainian president to investigate Joe Biden and his son. Another 27% have heard a little about this, and 21% have not heard anything. Democrats (62%) are somewhat more likely than Republicans (52%) and independents (47%) to say they have heard a lot about this. Among all Americans, 63% say it is not appropriate for a U.S. president to make this type of request to a foreign leader. Just 21% say it is appropriate. Only 5% of Democrats and 20% of independents say this is appropriate, but Republicans are more divided with 43% saying this type of request is appropriate, 31% saying it is not, and 26% saying either it depends or they are not sure.
Just over 6-in-10 Americans (62%) believe it is likely that Trump mentioned the possibility of an investigation into Biden during his call with Zelenskiy, while 15% say he probably did not do this and 23% are unsure. Among those who have heard a lot about the incident, 76% say this conversation probably occurred, 12% say it probably did not, and 12% are unsure. Among all Democrats, 85% believe that Trump mentioned the investigation during the call, a number that goes up to 97% among Democrats who have heard a lot about it. Among all independents, 61% believe that Trump mentioned the investigation during the call, a number that goes up to 73% among independents who have heard a lot. Among all Republicans, though, just 40% believe that Trump mentioned the investigation during the call. This number goes up only to 50% among Republicans who have heard a lot about the call. Nearly 3-in-10 of all Republicans (29%) as well as the subset of Republicans who have heard a lot about the call (29%) say the investigation into Biden was probably not mentioned by Trump.
“At the very least, it is clear from the readout that Trump discussed investigating Biden during the call. Even though this information was released by the White House itself, more than one quarter of Republicans still say Trump probably didn’t make any mention of it. This seems to be another example of partisan tribalism at work in public opinion,” said Murray.
When asked about the nature of that exchange, 45% of the public say Trump made promises or put pressure on Zelenskiy to investigate Biden, while 20% believe he did not do this. Another 19% are unsure and 16% say the exchange did not happen. Among those who have heard a lot about the call, 53% would describe the exchange as Trump making promises or exerting pressure while 23% would not describe it that way. Among Republicans overall, just 16% say Trump made promises or put pressure on Zelenskiy, while 35% say he did not. Among Republicans who have heard a lot about the call, 13% characterize the exchange as Trump making promises or exerting pressure – about the same as all Republicans – but 45% say that this did not happen, which is actually higher than for all Republicans.
The poll also asked about how the whistleblower complaint was handled and found nearly two-thirds (64%) saying that it was not appropriate for the Director of National Intelligence to withhold this complaint from Congress. Just 19% say withholding the complaint was appropriate. By party, 85% of Democrats, 61% of independents, and 46% of Republicans call this action inappropriate. The vast majority of Americans (77%) feel the whistleblower concerns involving the U.S. President should not be exempted from the requirement to report these complaints to Congress. Just 12% feel an exception should be made if the president is the subject of the complaint.
The public is divided on the veracity of Trump’s claim that Biden pressured Ukrainian officials to keep them from investigating his son’s business ties. The poll finds 42% who say that Biden probably did exert this pressure and 37% say this probably did not happen, with another 22% who are unsure. Independents are slightly more likely to feel that Biden did (43%) rather than did not (31%) pressure Ukrainian officials to keep them from investigating his son.
“Trump may be facing backlash for this call but the irony is now that its contents are out there, it may actually help with his objective. And that is to sow doubt about Biden among voters,” said Murray.
The Monmouth University Poll also finds there has been little movement in either the rating of Congress or the country’s direction since recent events. Currently, 21% of Americans approve of the job Congress is doing and 68% disapprove. This rating stood at 17% approve and 71% disapprove in August. Three-in-10 (30%) say the country is headed in the right direction while 61% say things have gotten off on the wrong track. This question stood at 28% right direction and 62% wrong track in August.
The whistleblower story rapidly evolved during the past week. Monmouth did not select an individually representative sample during each night of polling, but did perform a supplemental analysis of the data by weighting the interviews collected over three sets of dates (Monday-Tuesday, Wednesday-Thursday, and Friday-Sunday) to match on age, gender, race, education and party identification. Examining the results by date using this rebalanced sample needs to be taken with a caveat about the sample, but they do suggest there were no truly significant changes in fundamental public opinion about the president and impeachment during this time, although there may have been some shifts in opinion about the recent news itself.
The president’s job approval rating hovered between 39% and 43% over the course of interviewing, which is within the margin of error for each set of interviewing dates analyzed. Similarly, support for removing Trump from office via impeachment stayed within a narrow range (42% to 46%). Opinion on holding an official impeachment inquiry increased on both sides of the issue. Those saying it is a good idea went up from 46% on Monday-Tuesday to 48% on Wednesday-Thursday and 50% on Friday-Sunday while those saying it is a bad idea also went up, from 40% on Mon-Tue to 44% on Wed-Thu and 45% on Fri-Sun. Those having no opinion on whether the inquiry is a good or bad idea went down from 13% to 7% to 4% over the same period.
Awareness of the call between Trump and Zelenskiy increased significantly as the week progressed, going from 39% who heard a lot on Mon-Tue to 53% on Wed-Thu and 58% on Fri-Sun. The belief that Trump broached an investigation into Biden during the call increased only slightly, though, from 57% on Mon-Tue to 65% on Wed-Thu and 63% Fri-Sun. Also, the sense that it is appropriate for a U.S. president to make this type of request actually doubled over the field period (from 13% to 22% to 26%), while the sense that it was not appropriate declined slightly (from 66% to 63% to 61%).
“These results suggest that as the story started to permeate the public, there was an increase of digging in to partisan talking points,” said Murray.
Monmouth University conducted the poll by telephone from September 23 to 29, 2019 with 1,161 adults in the United States. The question results in this release have a margin of error of +/- 2.9 percentage points. The poll was conducted by the Monmouth University Polling Institute in West Long Branch.
QUESTIONS AND RESULTS
(* Some columns may not add to 100% due to rounding.)
1. Do you approve or disapprove of the job Donald Trump is doing as president?
|
TREND: |
Sept. |
Aug. |
June |
May |
April 2019 |
March 2019 |
Jan. |
Nov. |
Aug. |
June |
April |
March |
Jan. |
|
Approve |
41% |
40% |
41% |
40% |
40% |
44% |
41% |
43% |
43% |
43% |
41% |
39% |
42% |
|
Disapprove |
53% |
53% |
50% |
52% |
54% |
51% |
54% |
49% |
50% |
46% |
50% |
54% |
50% |
|
(VOL) No opinion |
6% |
7% |
9% |
8% |
6% |
5% |
5% |
8% |
7% |
11% |
9% |
8% |
8% |
|
(n) |
(1,161) |
(800) |
(751) |
(802) |
(801) |
(802) |
(805) |
(802) |
(805) |
(806) |
(803) |
(803) |
(806) |
|
TREND: Continued |
Dec. |
Sept. |
Aug. |
July |
May |
March |
|
Approve |
32% |
40% |
41% |
39% |
39% |
43% |
|
Disapprove |
56% |
49% |
49% |
52% |
53% |
46% |
|
(VOL) No opinion |
12% |
11% |
10% |
9% |
8% |
11% |
|
(n) |
(806) |
(1,009) |
(805) |
(800) |
(1,002) |
(801) |
2. Do you approve or disapprove of the job the U.S. Congress is doing?
|
TREND: |
Sept. |
Aug. |
June |
May |
April |
March |
Jan. |
|
Approve |
21% |
17% |
19% |
20% |
24% |
23% |
18% |
|
Disapprove |
68% |
71% |
69% |
71% |
62% |
68% |
72% |
|
(VOL) No opinion |
11% |
13% |
12% |
9% |
14% |
9% |
10% |
|
(n) |
(1,161) |
(800) |
(751) |
(802) |
(801) |
(802) |
(805) |
|
TREND: Continued |
Nov. |
Aug. |
June |
April |
March |
Jan. |
Dec. |
Sept. |
Aug. |
July |
May |
March |
Jan. |
|
Approve |
23% |
17% |
19% |
17% |
18% |
21% |
16% |
17% |
18% |
19% |
19% |
25% |
23% |
|
Disapprove |
63% |
69% |
67% |
71% |
72% |
68% |
65% |
69% |
69% |
70% |
68% |
59% |
66% |
|
(VOL) No opinion |
14% |
14% |
14% |
12% |
11% |
11% |
19% |
15% |
13% |
11% |
13% |
16% |
11% |
|
(n) |
(802) |
(805) |
(806) |
(803) |
(803) |
(806) |
(806) |
(1,009) |
(805) |
(800) |
(1,002) |
(801) |
(801) |
|
TREND: Continued |
Sept. |
Aug. |
June |
March |
Jan. |
Dec. |
Oct. |
Sept. |
Aug. |
July |
June |
April |
Jan. |
Dec. |
July |
|
Approve |
15% |
14% |
17% |
22% |
17% |
16% |
17% |
19% |
18% |
18% |
19% |
21% |
18% |
17% |
14% |
|
Disapprove |
77% |
78% |
76% |
68% |
73% |
73% |
71% |
71% |
72% |
69% |
71% |
67% |
70% |
73% |
76% |
|
(VOL) No opinion |
8% |
9% |
7% |
10% |
10% |
10% |
12% |
11% |
11% |
12% |
10% |
12% |
11% |
11% |
10% |
|
(n) |
(802) |
(803) |
(803) |
(1,008) |
(1,003) |
(1,006) |
(1,012) |
(1,009) |
(1,203) |
(1,001) |
(1,002) |
(1,005) |
(1,003) |
(1,008) |
(1,012) |
*Registered voters
3. Would you say things in the country are going in the right direction, or have they gotten off on the wrong track?
|
TREND: |
Sept. |
Aug. |
June |
May |
April |
March |
Nov. |
Aug. |
June |
April |
March |
Jan. |
|
Right direction |
30% |
28% |
31% |
29% |
28% |
29% |
35% |
35% |
40% |
33% |
31% |
37% |
|
Wrong track |
61% |
62% |
62% |
63% |
62% |
63% |
55% |
57% |
53% |
58% |
61% |
57% |
|
(VOL) Depends |
6% |
8% |
6% |
4% |
7% |
6% |
7% |
6% |
3% |
5% |
6% |
3% |
|
(VOL) Don’t know |
2% |
2% |
2% |
3% |
3% |
2% |
3% |
3% |
3% |
4% |
1% |
3% |
|
(n) |
(1,161) |
(800) |
(751) |
(802) |
(801) |
(802) |
(802) |
(805) |
(806) |
(803) |
(803) |
(806) |
|
TREND: Continued |
Dec. |
Aug. |
May |
March |
Jan. |
Aug. |
Oct. |
July |
June |
April |
Dec. |
July |
|
Right direction |
24% |
32% |
31% |
35% |
29% |
30% |
24% |
28% |
23% |
27% |
23% |
28% |
|
Wrong track |
66% |
58% |
61% |
56% |
65% |
65% |
66% |
63% |
68% |
66% |
69% |
63% |
|
(VOL) Depends |
7% |
4% |
5% |
4% |
4% |
2% |
6% |
5% |
5% |
5% |
5% |
5% |
|
(VOL) Don’t know |
3% |
5% |
3% |
5% |
2% |
3% |
4% |
3% |
3% |
2% |
3% |
4% |
|
(n) |
(806) |
(805) |
(1,002) |
(801) |
(801) |
(803) |
(1,012) |
(1,001) |
(1,002) |
(1,005) |
(1,008) |
(1,012) |
*Registered voters
[Note: Q4 was rotated with Q5-Trump reelection question, which will be released tomorrow.]
4. Do you think President Trump should be impeached and compelled to leave the Presidency, or not?
|
TREND: |
Sept. |
Aug. |
June |
May |
March |
Nov. |
April |
Jan. |
July |
|
Yes, should |
44% |
35% |
35% |
39% |
42% |
36% |
39% |
38% |
41% |
|
No, should not |
52% |
59% |
59% |
56% |
54% |
59% |
56% |
57% |
53% |
|
(VOL) Don’t know |
5% |
6% |
6% |
5% |
4% |
5% |
5% |
4% |
6% |
|
(n) |
(1,161) |
(800) |
(751) |
(802) |
(802) |
(802) |
(803) |
(806) |
(800) |
[Q5-10 held for future release.]
11X. Do you think it is a good idea or bad idea for the House Judiciary Committee to conduct an impeachment inquiry into President Trump that may or may not lead to impeachment?
|
|
Sept. |
Aug. |
|
Good idea |
49% |
41% |
|
Bad idea |
43% |
51% |
|
(VOL) Both |
1% |
1% |
|
(VOL) Don’t know |
7% |
6% |
|
(n) |
(1,161) |
(800) |
11. Have you heard anything about recent reports that Donald Trump asked the Ukrainian president to investigate Joe Biden and his son, or haven’t you heard about this? [If YES: Have you heard a lot or just a little?]
|
|
Sept. |
|
Yes, a lot |
52% |
|
Yes, a little |
27% |
|
No, not heard |
21% |
|
(n) |
(1,161) |
12. Is it appropriate or not appropriate for a U.S. president to make this type of request to a foreign leader?
|
|
Sept. |
|
Appropriate |
21% |
|
Not appropriate |
63% |
|
(VOL) Depends |
6% |
|
(VOL) Don’t know |
10% |
|
(n) |
(1,161) |
13. Do you think Donald Trump probably did or probably did not mention the possibility of an investigation into the Biden family during his conversation with the Ukrainian president?
|
|
Sept. |
|
Probably did |
62% |
|
Probably did not |
15% |
|
(VOL) Don’t know |
23% |
|
(n) |
(1,161) |
13A. If this conversation happened, do you think Trump made any promises or put any pressure on the Ukrainian president in return for investigating Biden, such as giving or withholding aid, or did he not do this?
|
|
Sept. |
|
Yes, made promises/put pressure |
45% |
|
No, did not do this |
20% |
|
(VOL) Rejects choice or did not happen (from Q13) |
16% |
|
(VOL) Don’t know |
19% |
|
(n) |
(1,161) |
14. A whistleblower in an intelligence agency filed a complaint about this conversation, but the complaint was not initially shared with congressional leadership. Is it appropriate or not appropriate for the Director of National Intelligence to withhold this whistleblower complaint from Congress?
|
|
Sept. |
|
Appropriate |
19% |
|
Not appropriate |
64% |
|
(VOL) Depends |
5% |
|
(VOL) Don’t know |
12% |
|
(n) |
(1,161) |
15. The Director of National Intelligence is required to report most whistleblower complaints to members of the House and Senate Intelligence Committees. Should an exception be made if the subject of the complaint is the president, or should there be no exceptions to this reporting requirement for the president?
|
|
Sept. |
|
Exception made for the president |
12% |
|
No exceptions for the president |
77% |
|
(VOL) Depends |
3% |
|
(VOL) Don’t know |
8% |
|
(n) |
(1,161) |
16. President Trump claims that Joe Biden put pressure on Ukrainian officials to get them not to investigate his son’s business dealings there. Do you think Biden probably did or probably did not do this?
|
|
Sept. |
|
Probably did |
42% |
|
Probably did not |
37% |
|
(VOL) Don’t know |
22% |
|
(n) |
(1,161) |
[Q17-30 held for future release.]
METHODOLOGY
The Monmouth University Poll was sponsored and conducted by the Monmouth University Polling Institute from September 23 to 29, 2019 with a national random sample of 1,161 adults age 18 and older, in English. This includes 465 contacted by a live interviewer on a landline telephone and 696 contacted by a live interviewer on a cell phone. Telephone numbers were selected through random digit dialing and landline respondents were selected with a modified Troldahl-Carter youngest adult household screen. Monmouth is responsible for all aspects of the survey design, data weighting and analysis. Final sample is weighted for region, age, education, gender and race based on US Census information. Data collection support provided by Braun Research (field) and Dynata (RDD sample). For results based on this sample, one can say with 95% confidence that the error attributable to sampling has a maximum margin of plus or minus 2.9 percentage points (unadjusted for sample design). Sampling error can be larger for sub-groups (see table below). In addition to sampling error, one should bear in mind that question wording and practical difficulties in conducting surveys can introduce error or bias into the findings of opinion polls.
|
DEMOGRAPHICS (weighted) |
|
Self-Reported |
|
26% Republican |
|
44% Independent |
|
30% Democrat |
|
|
|
48% Male |
|
52% Female |
|
|
|
31% 18-34 |
|
33% 35-54 |
|
35% 55+ |
|
|
|
64% White |
|
12% Black |
|
16% Hispanic |
|
8% Asian/Other |
|
|
|
69% No degree |
|
31% 4 year degree |
|
|
|
MARGIN OF ERROR |
|||
|
unweighted sample |
moe |
||
|
TOTAL |
|
1,161 |
2.9% |
|
REGISTERED VOTER |
Yes |
1,017 |
3.1% |
|
No |
144 |
8.2% |
|
|
SELF-REPORTED PARTY ID |
Republican |
309 |
5.6% |
|
Independent |
484 |
4.5% |
|
|
Democrat |
342 |
5.3% |
|
|
IDEOLOGY |
Liberal |
288 |
5.8% |
|
Moderate |
397 |
4.9% |
|
|
Conservative |
429 |
4.7% |
|
|
GENDER |
Male |
570 |
4.1% |
|
Female |
591 |
4.0% |
|
|
AGE |
18-34 |
273 |
5.9% |
|
35-54 |
390 |
5.0% |
|
|
55+ |
487 |
4.5% |
|
|
RACE |
White, non-Hispanic |
835 |
3.4% |
|
Other |
279 |
5.9% |
|
|
COLLEGE GRADUATE |
No degree |
595 |
4.0% |
|
4 year degree |
558 |
4.2% |
|
|
WHITE COLLEGE |
White, no degree |
408 |
4.9% |
|
White, 4 year degree |
420 |
4.8% |
|
|
INCOME |
<$50K |
365 |
5.1% |
|
$50 to <100K |
332 |
5.4% |
|
|
$100K+ |
364 |
5.1% |
|
|
2016 VOTE BY COUNTY
|
Trump 10+ pts |
411 |
4.8% |
|
Swing <10 pts |
247 |
6.2% |
|
|
Clinton 10+ pts |
503 |
4.4% |
|


